Quick check: how many of you have seen a commit like this before?
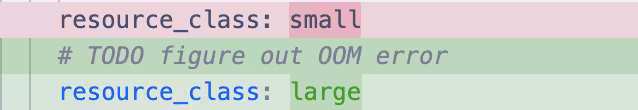
Did you ever actually fix that out-of-memory error? Do you even have the data to figure out what caused it?
Without visibility into what's actually happening on your CI agents, you're left guessing. Is that E2E suite consuming too much memory? Are you running too many tasks in parallel? Should you upgrade to larger agents or is the current size fine?
You need data to make informed decisions about your CI infrastructure. That's exactly what Agent Resource Usage delivers: complete visibility into CPU and memory consumption at the task level, so you can stop guessing and start optimizing.
The Black Box Problem: Why CI Resource Visibility Matters
Most CI systems tell you when something fails but not why. When it comes to resource consumption, you're often flying blind.
Here's what this looks like in practice:
- Agent restarts happen without explanation. Was it memory pressure? CPU throttling? You're not sure.
- Out-of-memory errors appear sporadically. Which task is the culprit? Is it the same task every time? You don't have enough data to know.
- Timeouts occur on specific tasks, but you can't tell if it's a CPU bottleneck or something else.
- Inconsistent performance plagues your pipelines, and you can't identify the root cause.
The cost of guessing is real. Over-provision your agents and you're wasting money on resources you don't need. Under-provision them and you're dealing with slow performance, failures, frustrated developers, and blocked pipelines. Not to mention you're spending valuable time manually investigating issues by piecing together what little data you have.
What you really need is data to make informed decisions about your CI infrastructure. The ability to right-size your agents and diagnose problems quickly drives cost savings and developer productivity.
See What's Actually Happening with Agent Resource Usage
Agent Resource Usage brings transparency to your CI agents. Instead of wondering what happened, you can see exactly what's consuming resources and when.
You'll find this feature in the Analysis section of your CI Pipeline Executions (CIPEs) in Nx Cloud. It provides two levels of visibility: a summary view that shows all agents at a glance, and a detailed view that breaks down resource usage process-by-process.
This level of detail isn't standard in CI tools. Most providers offer basic resource metrics if you configure additional services, but task-level breakdowns are only possible with the deep understanding of your task graph with Nx.
Summary View: Identify Problem Agents Quickly
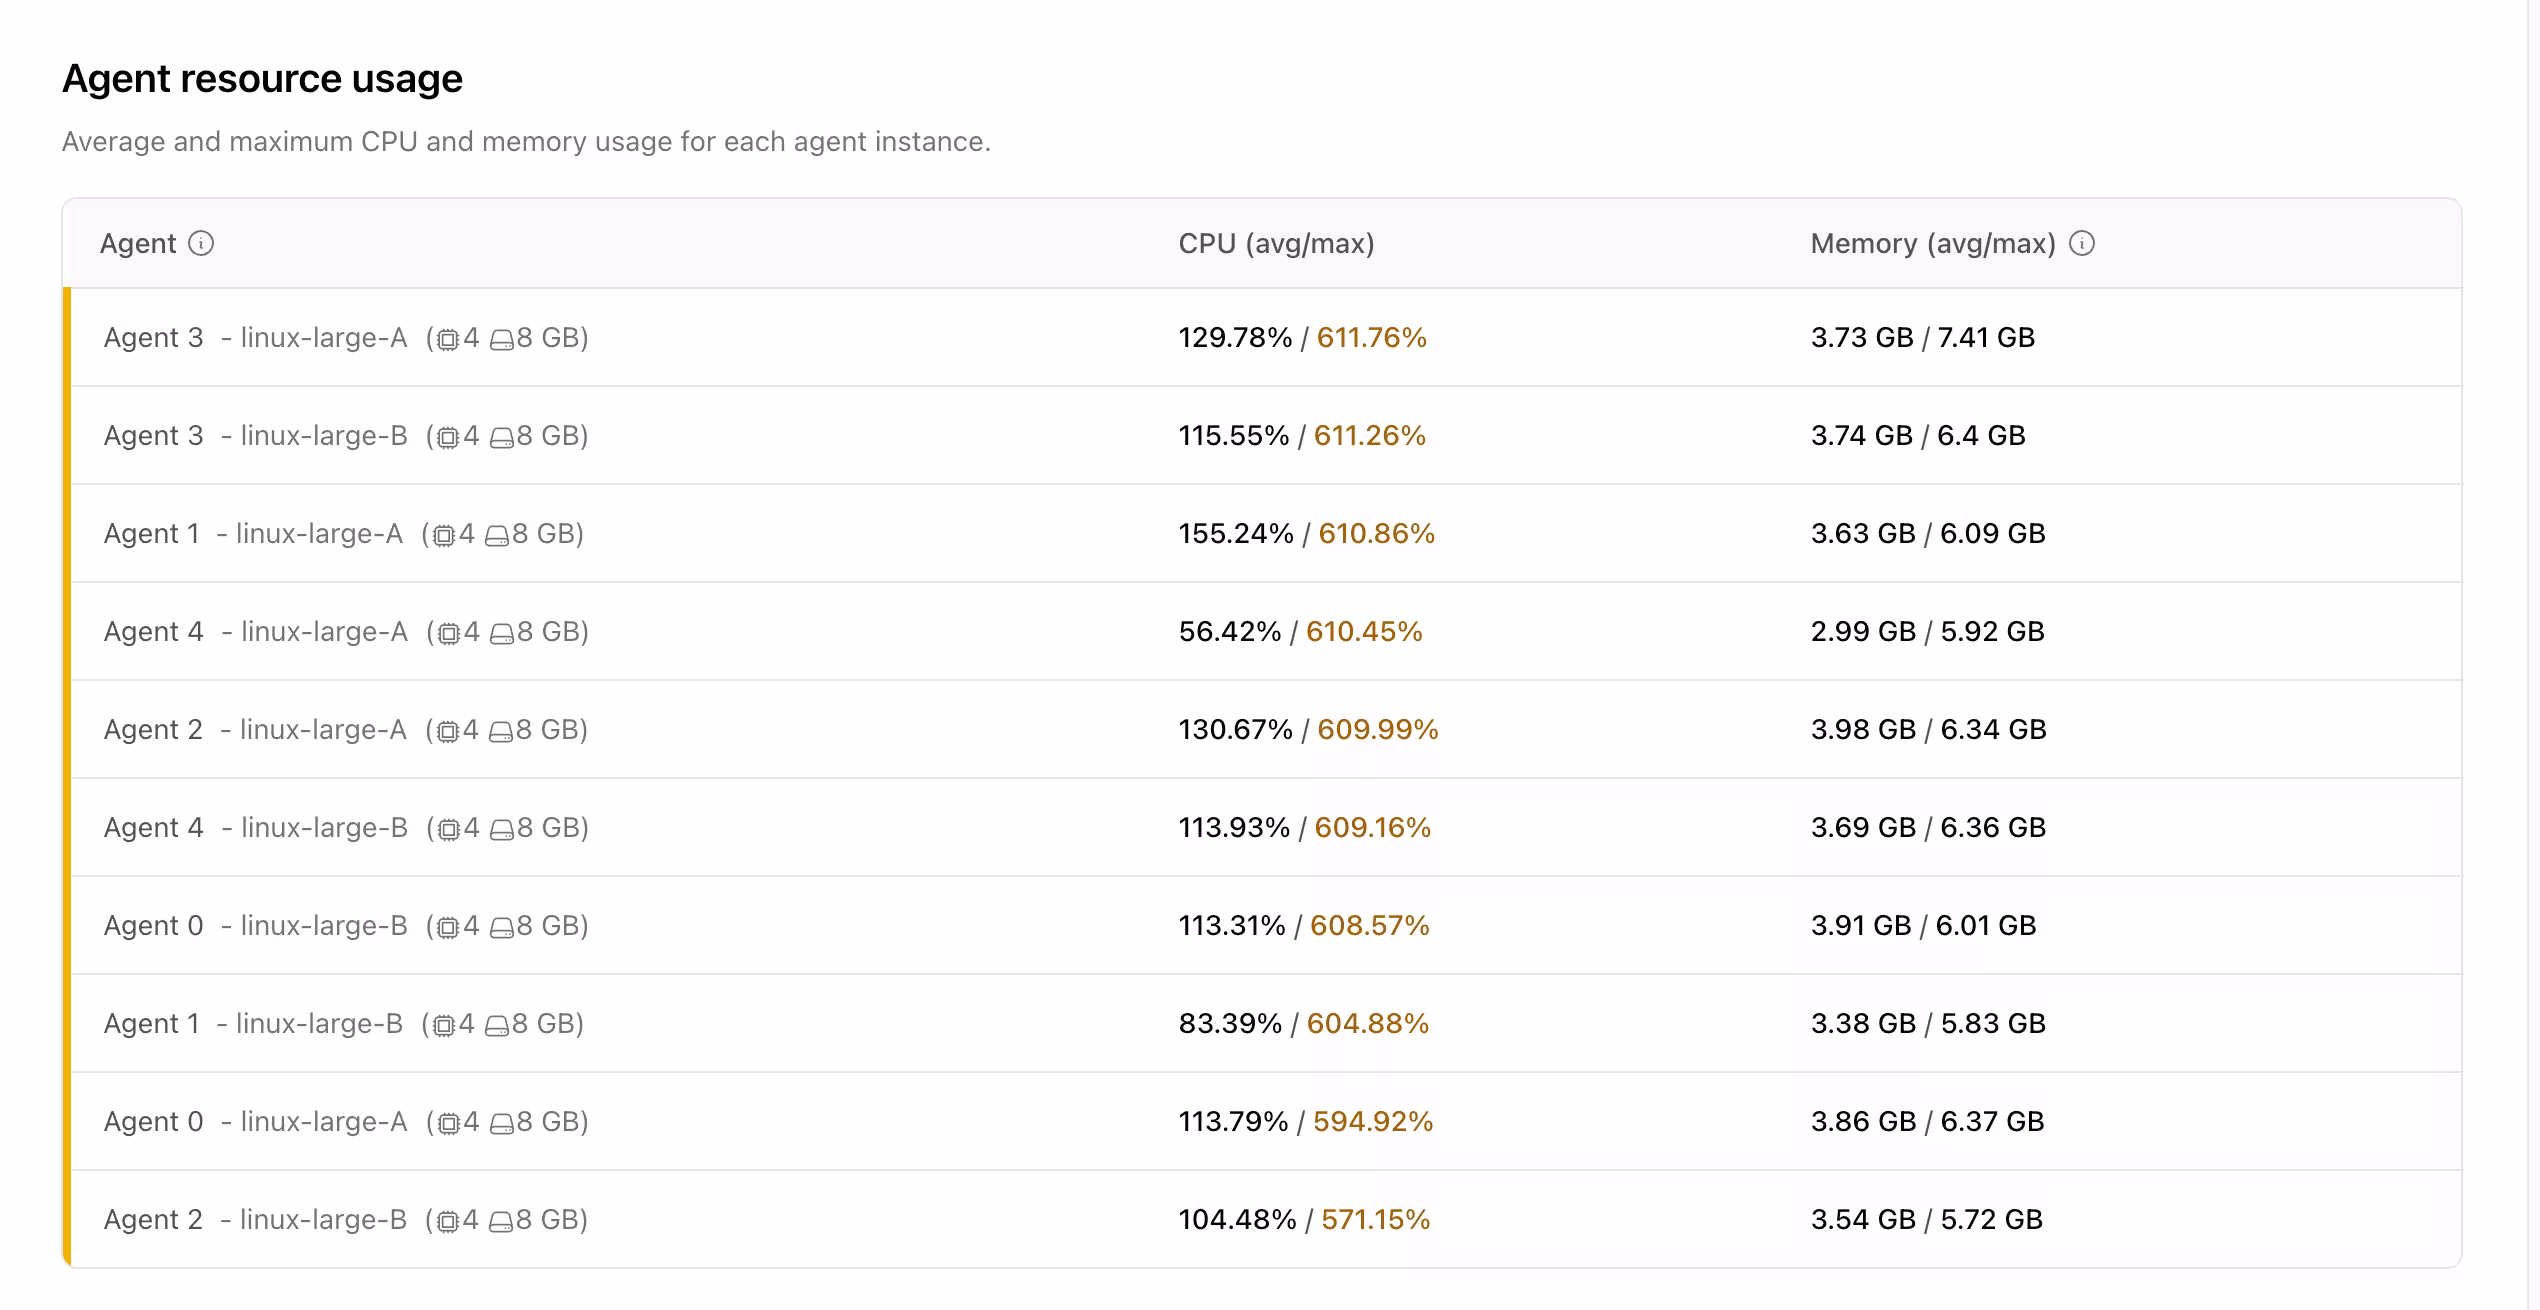
The summary view gives you a complete picture of agent performance for a given CIPE. You'll see:
- A list of all agents used in the CIPE, along with their resource class
- Average and maximum CPU and memory usage for each agent
- Detected machine specs for each resource class
This view helps you quickly spot agents that are hitting resource limits, compare performance across different agent types, and identify which agents need further investigation.
Detailed View: Pinpoint the Exact Culprit
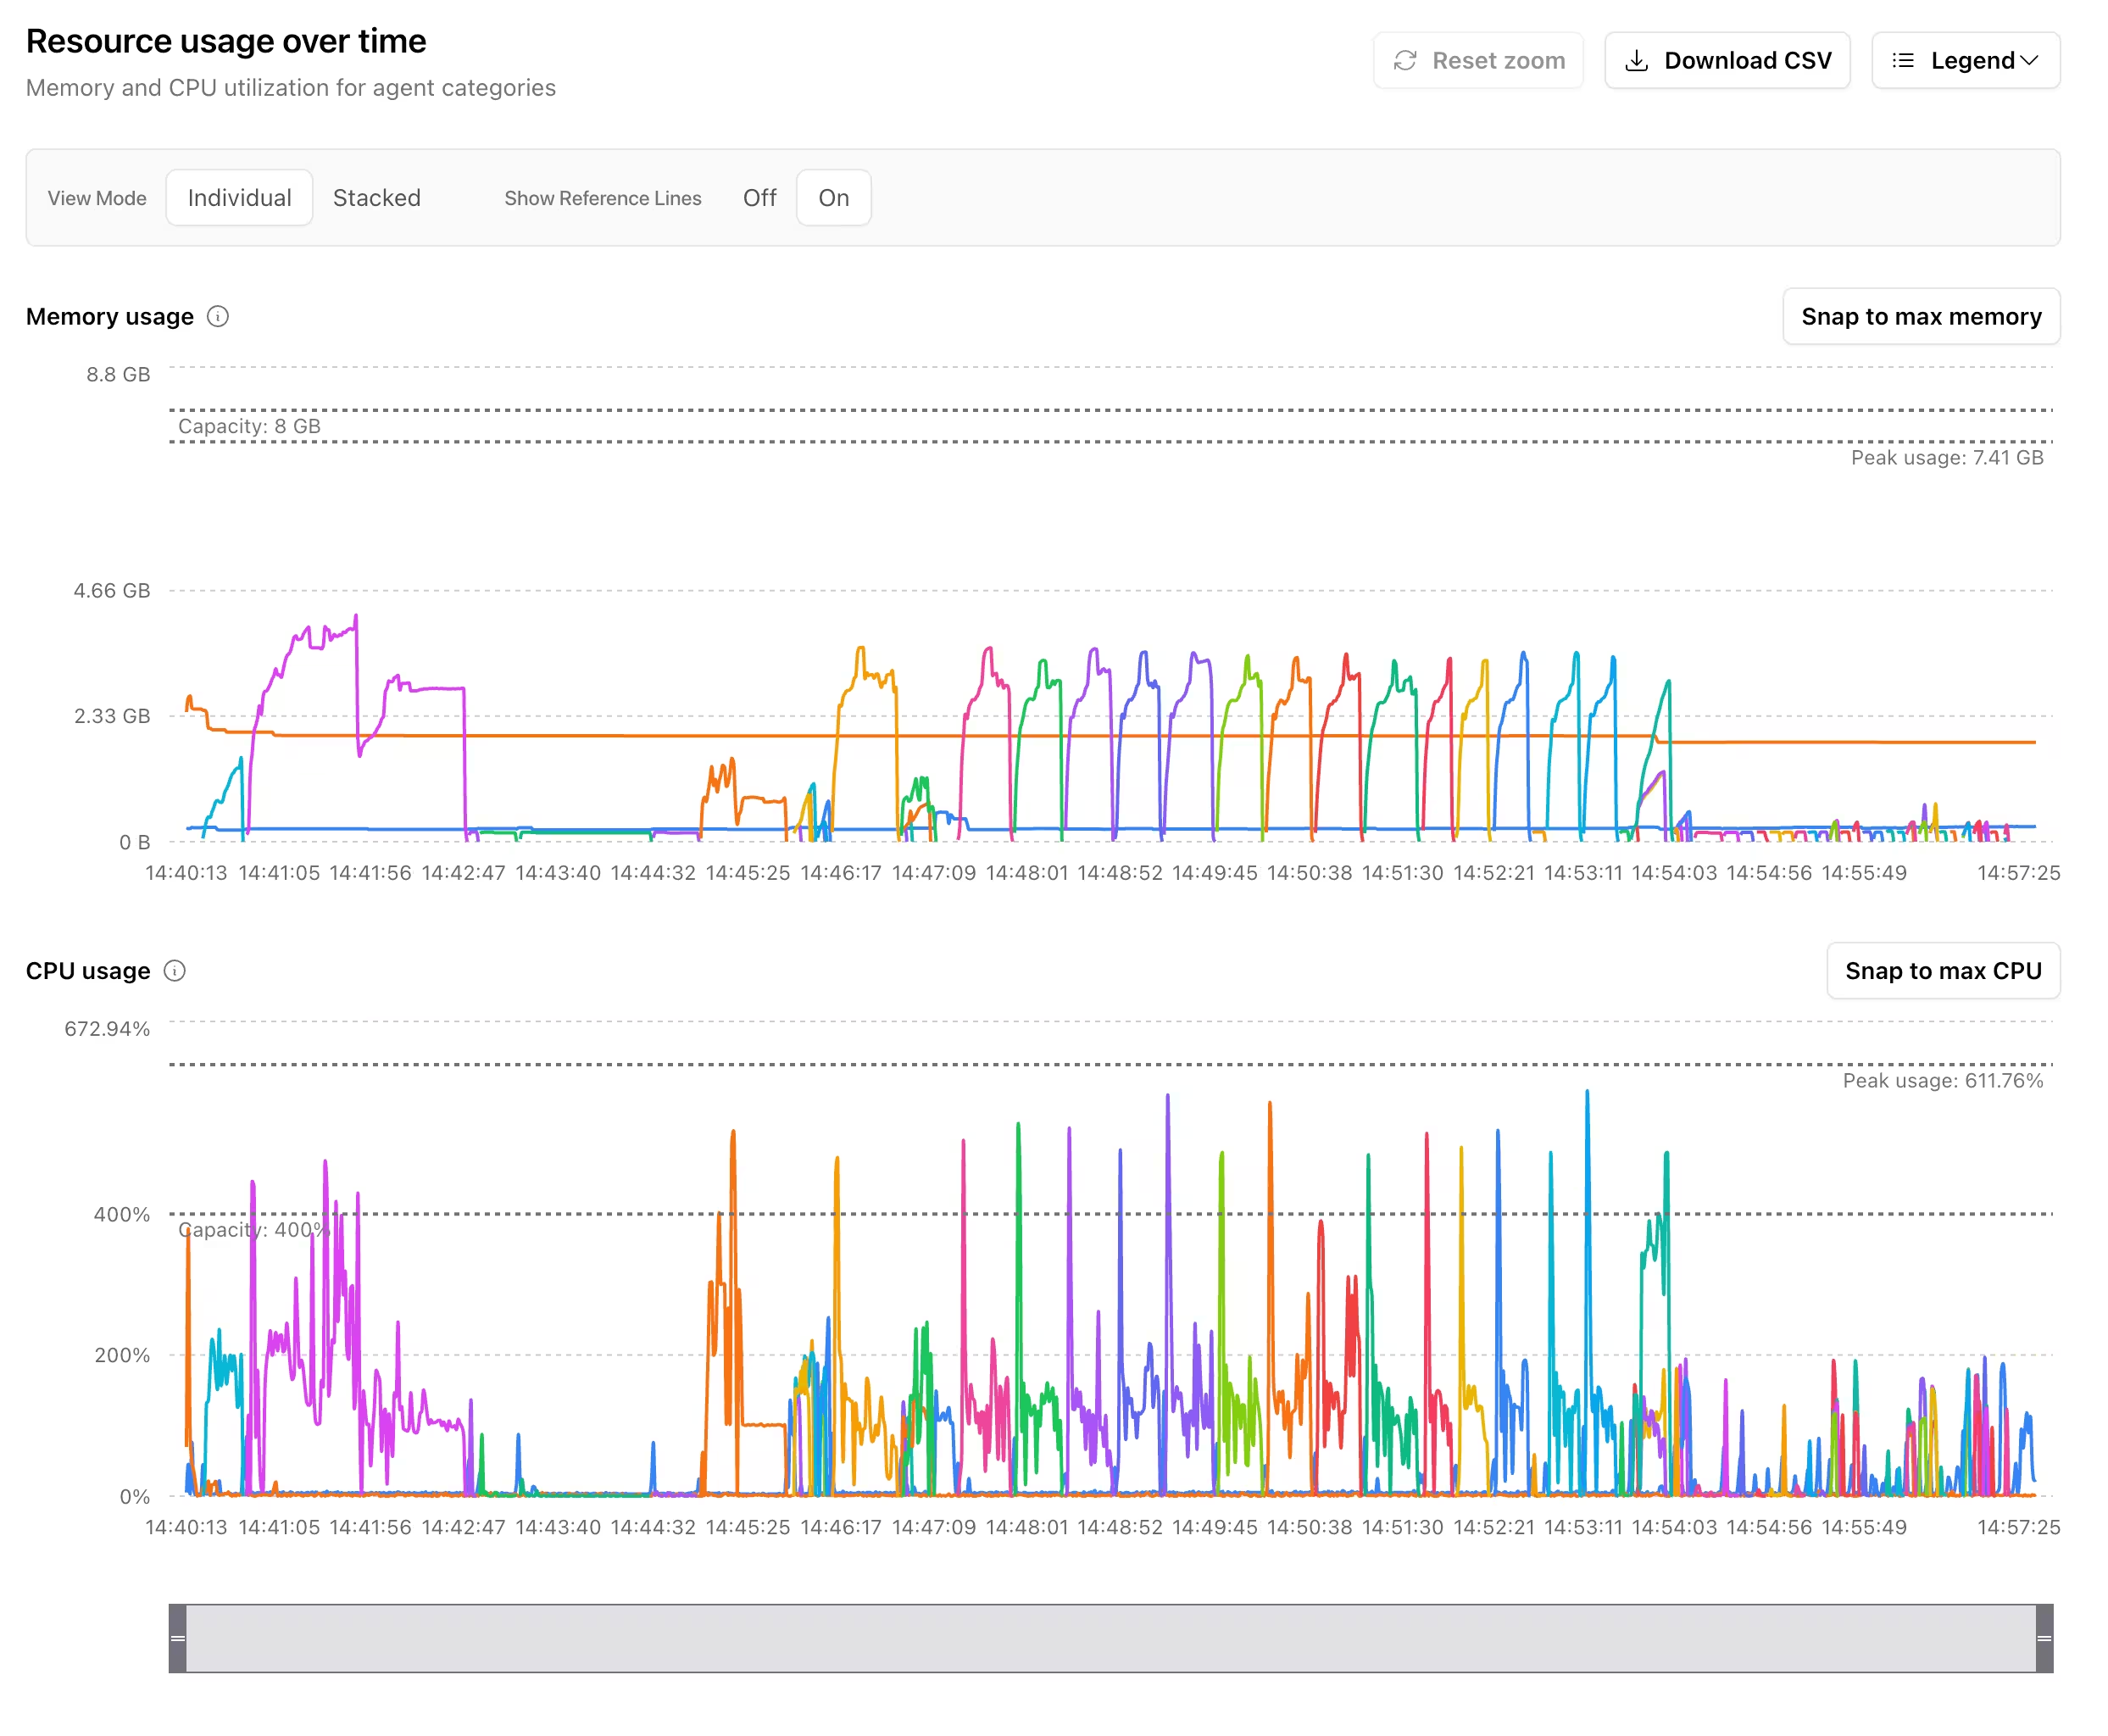
Select any agent from the summary view, and you'll get a detailed breakdown of what happened on that agent. This is where Agent Resource Usage really shines.
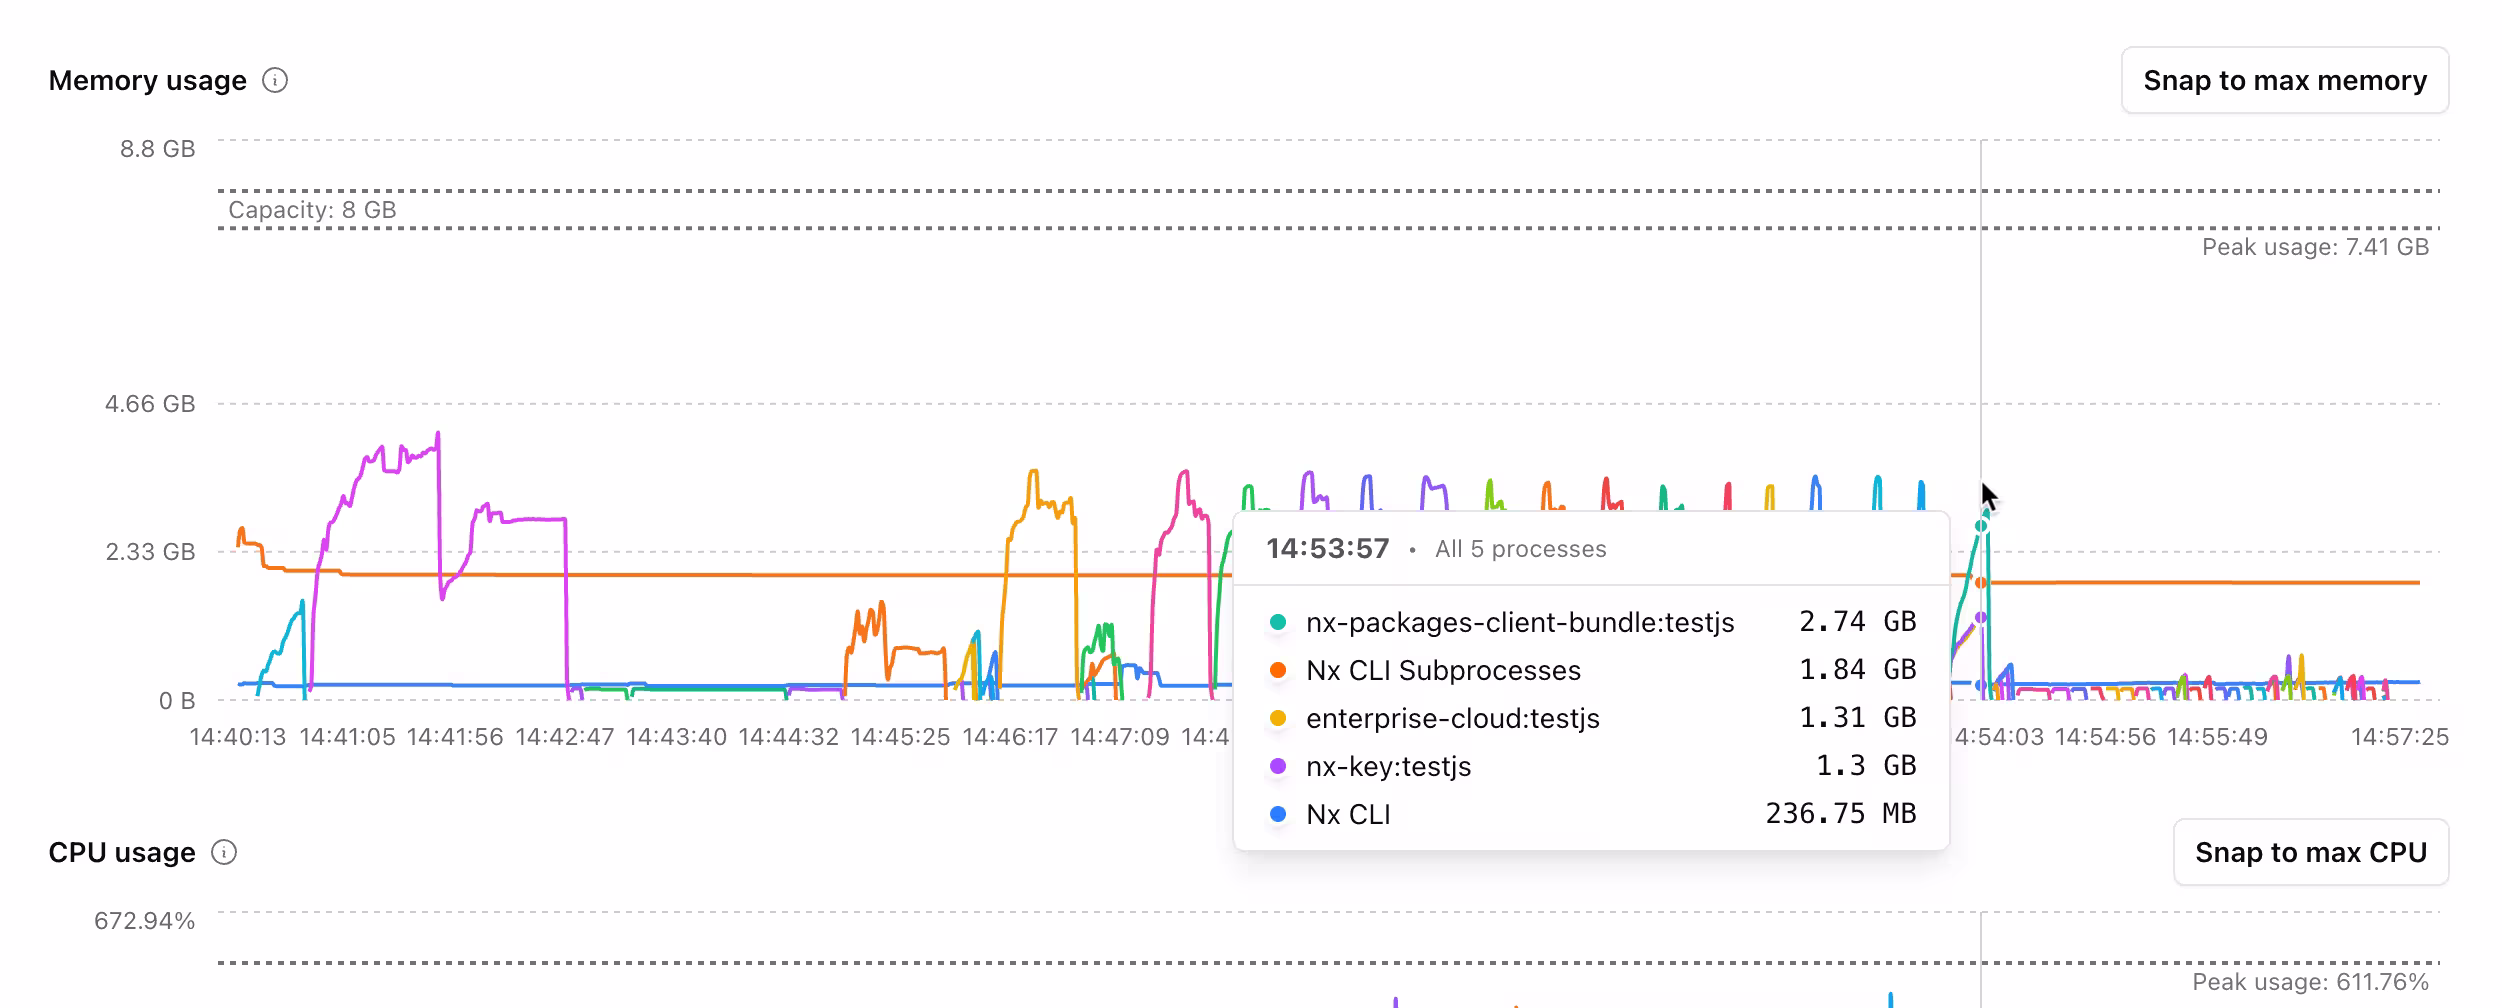
You'll see time-series graphs showing CPU and memory usage over the agent's lifetime, broken down by process. This includes the Nx CLI itself as well as individual tasks and their subprocesses. You’re no longer stuck wondering which task is causing the node process to run out of memory. You can see the exact task running and investigate the root cause.
The interface includes several features to help you navigate the data:
- Interactive legend - Click on any process to focus on it
- Timeline scrubber - Navigate through the agent's lifetime and zoom into specific time periods
- Snap to max buttons - Instantly jump to the point of maximum CPU or memory usage
- Individual vs. stacked view - Toggle between seeing processes individually or their combined usage
- CSV export - Download raw data for deeper analysis in your tool of choice
Real-World Use Cases: From Data to Decisions
Here's how Agent Resource Usage solves actual problems developers and platform teams face:
- Debug memory leaks and OOM errors - See the exact moment memory spiked and which task caused it. Track down misconfigured bundlers pulling in too many files or test suites not cleaning up properly.
- Optimize task parallelization - Find which specific tasks need lower parallelism instead of applying conservative settings globally. Keep most tasks fast while preventing resource failures on the handful that need special handling.
- Right-size your agents - See actual utilization patterns to determine if you're over or under-provisioned. Especially valuable when migrating from other CI providers with different resource specs.
- Track performance regressions - Compare resource usage before and after changes to see if resource consumption has increased. Make informed decisions about whether to proceed, roll back, or investigate further.
Not just Nx Agents: Manual DTE Support
If you're using Manual Distributed Task Execution with your own runners, Agent Resource Usage works for you too. You'll need to upload metrics data manually, but once you do, you get the same detailed visibility into resource consumption.
Check the documentation for details on retrieving metrics from the default file path and configuring custom paths for your setup.
Resource Optimization at Scale
For platform teams and engineering leadership, Agent Resource Usage represents more than just a debugging tool. It's a shift in how you manage CI infrastructure.
The business impact is tangible:
- Direct cost savings - Right-size your agents based on actual usage data rather than guesswork
- Reduced developer frustration - Fewer blocked pipelines and faster resolution when issues occur leads to increased productivity
- Data-driven infrastructure decisions - Make changes based on metrics, not assumptions
- Proactive optimization - Identify issues before they cause widespread problems
Your platform team benefits from self-service debugging. Developers can investigate their own resource issues without escalating to infrastructure teams. This frees up your platform engineers to work on higher-value initiatives rather than playing detective through log files. These task-level breakdowns with interactive visualization are rare for most CI providers, but standard for Nx.
Available Now for Enterprise Customers
Agent Resource Usage is available today for all Nx Enterprise customers. You'll need Nx 22.1 or greater to take advantage of this feature.
To get started, navigate to the Analysis section of any CI Pipeline Execution in your Nx Cloud dashboard. If you're using Nx Agents, the data is collected automatically. For manual DTE setups, refer to our documentation for upload instructions.
This feature complements other Enterprise capabilities like Task Analytics and the Polygraph suite (Workspace Graph, Conformance, and Custom Workflows), giving you comprehensive visibility into your development infrastructure.
Start optimizing your CI infrastructureSchedule a free trial to see how Nx Enterprise and Agent Resource Usage can transform your platform.
Stop guessing what's happening on your CI agents. Get complete visibility into resource consumption at the process level, identify problems quickly, optimize proactively, and build confidence in your CI infrastructure with Agent Resource Usage.


